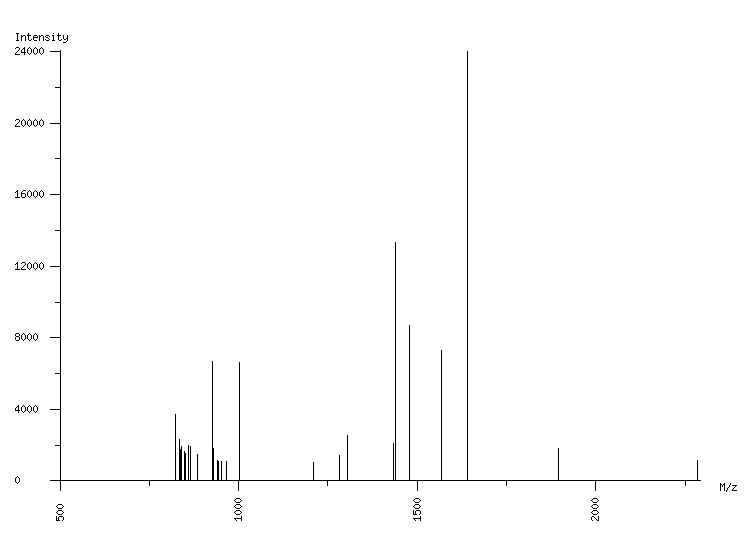
ORGANISM: Homo sapiens
GEL: Human AGS cells; cellular proteins; phosphoproteome
SPOT_ID: 120

|
| M/z |
| 822.29 |
| 824.29 |
| 833.32 |
| 836.30 |
| 838.30 |
| 839.33 |
| 848.31 |
| 850.31 |
| 861.10 |
| 864.31 |
| 886.29 |
| 927.50 |
| 930.32 |
| 942.33 |
| 944.32 |
| 951.32 |
| 966.36 |
| 1001.60 |
| 1209.60 |
| 1283.71 |
| 1305.72 |
| 1433.71 |
| 1439.81 |
| 1479.80 |
| 1567.75 |
| 1639.94 |
| 1894.94 |
| 2284.16 |
|
| Intensity |
| 1874 |
| 3691 |
| 2332 |
| 1737 |
| 1654 |
| 1917 |
| 1663 |
| 1524 |
| 1968 |
| 1912 |
| 1507 |
| 6660 |
| 1812 |
| 1131 |
| 1106 |
| 1091 |
| 1110 |
| 6640 |
| 1061 |
| 1400 |
| 2527 |
| 2072 |
| 13322 |
| 8708 |
| 7285 |
| 24005 |
| 1810 |
| 1161 |
|
|
(28 total) |
| | matched peaks |
| | contaminants |
|