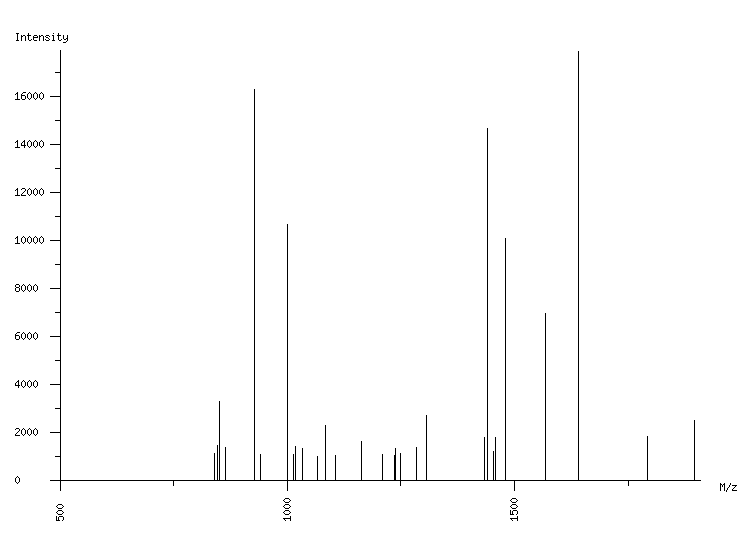
ORGANISM: Homo sapiens
GEL: Human AGS cells; cellular proteins; phosphoproteome
SPOT_ID: 118

|
| M/z |
| 839.42 |
| 847.49 |
| 850.52 |
| 864.52 |
| 927.49 |
| 941.50 |
| 1001.59 |
| 1014.60 |
| 1017.61 |
| 1033.58 |
| 1065.48 |
| 1083.59 |
| 1106.55 |
| 1163.62 |
| 1209.60 |
| 1235.54 |
| 1237.66 |
| 1249.67 |
| 1283.72 |
| 1305.71 |
| 1433.71 |
| 1439.82 |
| 1453.82 |
| 1457.66 |
| 1479.80 |
| 1567.75 |
| 1639.95 |
| 1791.74 |
| 1894.94 |
|
| Intensity |
| 1145 |
| 1482 |
| 3286 |
| 1392 |
| 16293 |
| 1100 |
| 10671 |
| 1084 |
| 1440 |
| 1362 |
| 1003 |
| 2325 |
| 1069 |
| 1633 |
| 1086 |
| 1059 |
| 1370 |
| 1162 |
| 1373 |
| 2709 |
| 1798 |
| 14672 |
| 1216 |
| 1790 |
| 10105 |
| 6980 |
| 17847 |
| 1840 |
| 2520 |
|
|
(29 total) |
| | matched peaks |
| | contaminants |
|