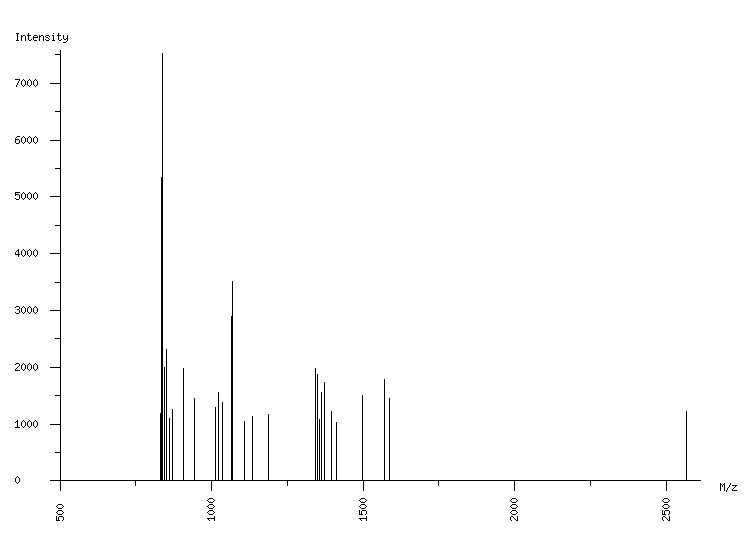
ORGANISM: Homo sapiens
GEL: Human AGS cells; cellular proteins; phosphoproteome
SPOT_ID: 117

|
| M/z |
| 830.43 |
| 833.39 |
| 838.50 |
| 839.42 |
| 845.41 |
| 850.53 |
| 851.45 |
| 860.51 |
| 872.55 |
| 908.98 |
| 943.55 |
| 1011.57 |
| 1023.61 |
| 1036.62 |
| 1064.55 |
| 1070.56 |
| 1109.71 |
| 1133.61 |
| 1187.55 |
| 1344.71 |
| 1350.73 |
| 1357.79 |
| 1361.69 |
| 1373.72 |
| 1395.72 |
| 1413.77 |
| 1498.82 |
| 1569.80 |
| 1586.80 |
| 2566.27 |
|
| Intensity |
| 1188 |
| 5335 |
| 1211 |
| 7526 |
| 2005 |
| 2309 |
| 2035 |
| 1104 |
| 1256 |
| 1979 |
| 1457 |
| 1300 |
| 1552 |
| 1374 |
| 2895 |
| 3509 |
| 1050 |
| 1130 |
| 1167 |
| 1981 |
| 1866 |
| 1074 |
| 1563 |
| 1727 |
| 1229 |
| 1036 |
| 1497 |
| 1795 |
| 1455 |
| 1230 |
|
|
(30 total) |
| | matched peaks |
| | contaminants |
|