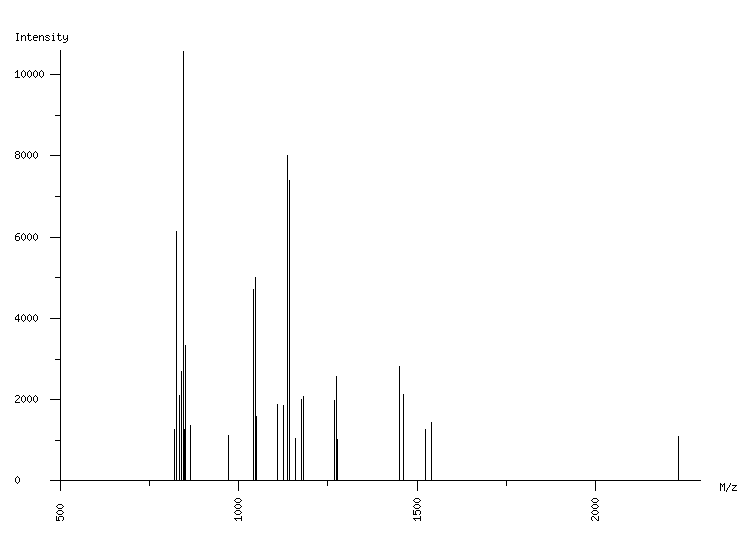
ORGANISM: Homo sapiens
GEL: Human AGS cells; cellular proteins; phosphoproteome
SPOT_ID: 108

|
| M/z |
| 821.46 |
| 825.12 |
| 833.46 |
| 839.45 |
| 841.08 |
| 845.10 |
| 847.10 |
| 848.51 |
| 850.52 |
| 851.50 |
| 864.52 |
| 972.56 |
| 1042.53 |
| 1048.55 |
| 1050.10 |
| 1108.63 |
| 1126.69 |
| 1136.58 |
| 1142.60 |
| 1160.61 |
| 1176.60 |
| 1182.61 |
| 1268.66 |
| 1274.68 |
| 1277.09 |
| 1450.73 |
| 1462.77 |
| 1522.81 |
| 1540.87 |
| 2233.08 |
|
| Intensity |
| 1268 |
| 6128 |
| 2102 |
| 2701 |
| 1703 |
| 10570 |
| 1051 |
| 1276 |
| 3327 |
| 2267 |
| 1362 |
| 1108 |
| 4708 |
| 5000 |
| 1594 |
| 1893 |
| 1846 |
| 8000 |
| 7381 |
| 1054 |
| 1994 |
| 2085 |
| 1976 |
| 2561 |
| 1010 |
| 2809 |
| 2140 |
| 1267 |
| 1432 |
| 1099 |
|
|
(30 total) |
| | matched peaks |
| | contaminants |
|