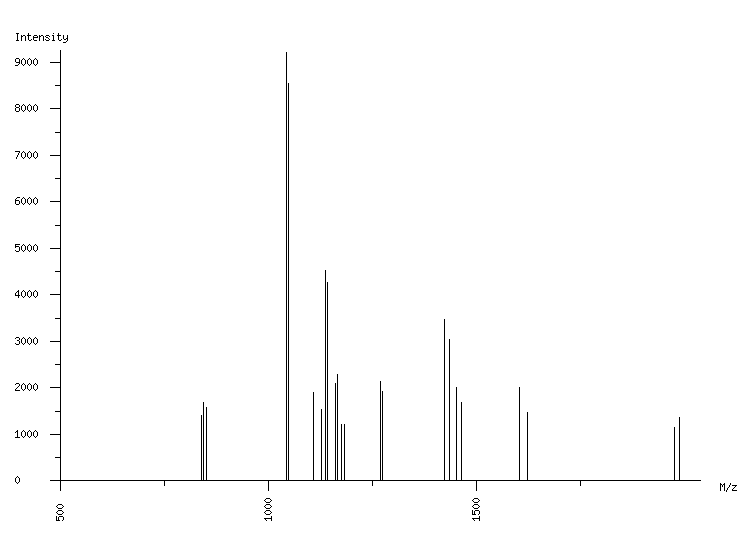
ORGANISM: Homo sapiens
GEL: Human AGS cells; cellular proteins; phosphoproteome
SPOT_ID: 107

|
| M/z |
| 839.44 |
| 845.09 |
| 850.52 |
| 851.49 |
| 1042.52 |
| 1048.54 |
| 1108.63 |
| 1126.69 |
| 1136.57 |
| 1142.58 |
| 1160.60 |
| 1166.63 |
| 1176.60 |
| 1182.62 |
| 1268.67 |
| 1274.68 |
| 1421.71 |
| 1433.74 |
| 1450.72 |
| 1462.76 |
| 1602.77 |
| 1620.83 |
| 1973.97 |
| 1986.01 |
|
| Intensity |
| 1405 |
| 1679 |
| 1034 |
| 1570 |
| 9218 |
| 8545 |
| 1896 |
| 1542 |
| 4528 |
| 4258 |
| 2087 |
| 2300 |
| 1222 |
| 1217 |
| 2144 |
| 1933 |
| 3468 |
| 3041 |
| 2011 |
| 1691 |
| 2010 |
| 1477 |
| 1153 |
| 1368 |
|
|
(24 total) |
| | matched peaks |
| | contaminants |
|