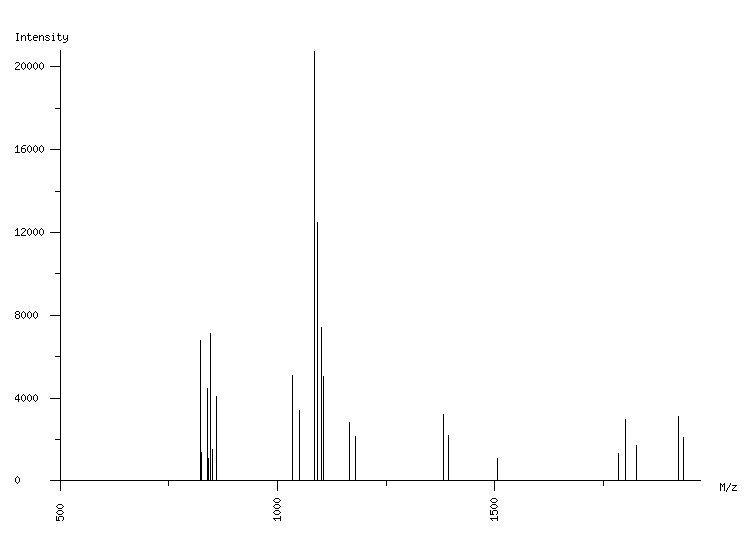
ORGANISM: Homo sapiens
GEL: Human AGS cells; cellular proteins; phosphoproteome
SPOT_ID: 106

|
| M/z |
| 823.12 |
| 825.12 |
| 839.09 |
| 841.09 |
| 845.11 |
| 850.53 |
| 861.08 |
| 1034.15 |
| 1050.12 |
| 1086.45 |
| 1092.47 |
| 1100.47 |
| 1106.49 |
| 1166.66 |
| 1178.67 |
| 1382.61 |
| 1394.64 |
| 1506.83 |
| 1783.88 |
| 1800.90 |
| 1824.98 |
| 1923.00 |
| 1935.04 |
|
| Intensity |
| 6775 |
| 1390 |
| 4490 |
| 1087 |
| 7109 |
| 1543 |
| 4062 |
| 5080 |
| 3405 |
| 20739 |
| 12480 |
| 7413 |
| 5058 |
| 2804 |
| 2156 |
| 3192 |
| 2183 |
| 1063 |
| 1333 |
| 2968 |
| 1724 |
| 3118 |
| 2080 |
|
|
(23 total) |
| | matched peaks |
| | contaminants |
|