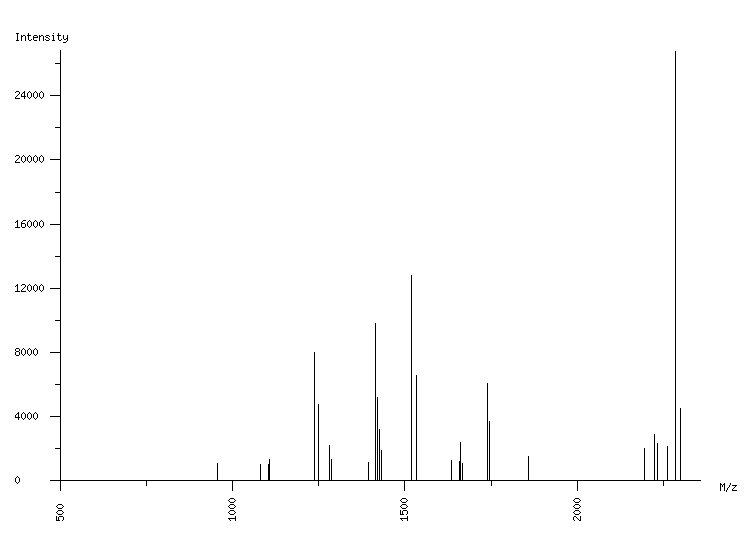
ORGANISM: Homo sapiens
GEL: Human AGS cells; cellular proteins; phosphoproteome
SPOT_ID: 102

|
| M/z |
| 957.52 |
| 1081.55 |
| 1106.05 |
| 1106.55 |
| 1237.66 |
| 1249.69 |
| 1281.70 |
| 1287.71 |
| 1393.75 |
| 1413.64 |
| 1419.66 |
| 1427.66 |
| 1433.68 |
| 1520.76 |
| 1532.80 |
| 1634.82 |
| 1659.73 |
| 1660.72 |
| 1666.74 |
| 1739.84 |
| 1745.87 |
| 1858.77 |
| 2194.59 |
| 2225.11 |
| 2233.09 |
| 2261.99 |
| 2284.17 |
| 2300.16 |
|
| Intensity |
| 1103 |
| 1057 |
| 1008 |
| 1354 |
| 8004 |
| 4772 |
| 2185 |
| 1341 |
| 1154 |
| 9821 |
| 5186 |
| 3224 |
| 1897 |
| 12827 |
| 6552 |
| 1305 |
| 1195 |
| 2385 |
| 1104 |
| 6051 |
| 3712 |
| 1537 |
| 2053 |
| 2874 |
| 2365 |
| 2163 |
| 26752 |
| 4531 |
|
|
(28 total) |
| | matched peaks |
| | contaminants |
|