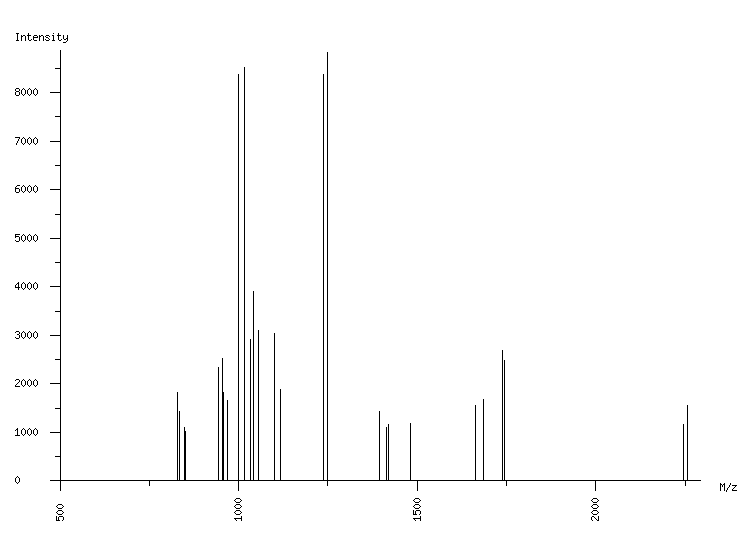
ORGANISM: Homo sapiens
GEL: Human AGS cells; cellular proteins; phosphoproteome
SPOT_ID: 97

|
| M/z |
| 829.47 |
| 835.49 |
| 848.53 |
| 850.52 |
| 943.53 |
| 955.57 |
| 957.52 |
| 969.56 |
| 999.58 |
| 1017.64 |
| 1033.57 |
| 1042.59 |
| 1054.64 |
| 1056.51 |
| 1099.64 |
| 1117.70 |
| 1236.75 |
| 1237.66 |
| 1249.70 |
| 1393.76 |
| 1413.65 |
| 1419.67 |
| 1481.77 |
| 1662.95 |
| 1687.03 |
| 1739.85 |
| 1745.87 |
| 2246.01 |
| 2258.05 |
|
| Intensity |
| 1827 |
| 1436 |
| 1096 |
| 1017 |
| 2344 |
| 2521 |
| 1818 |
| 1649 |
| 8365 |
| 8518 |
| 2921 |
| 3912 |
| 3094 |
| 1727 |
| 3046 |
| 1885 |
| 1265 |
| 8383 |
| 8827 |
| 1426 |
| 1094 |
| 1162 |
| 1184 |
| 1550 |
| 1681 |
| 2683 |
| 2476 |
| 1160 |
| 1557 |
|
|
(29 total) |
| | matched peaks |
| | contaminants |
|