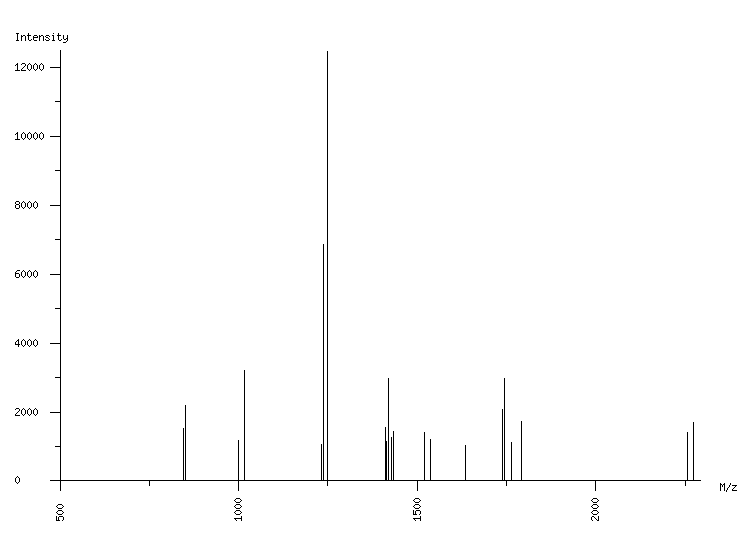
ORGANISM: Homo sapiens
GEL: Human AGS cells; cellular proteins; phosphoproteome
SPOT_ID: 85

|
| M/z |
| 845.08 |
| 850.52 |
| 999.58 |
| 1017.64 |
| 1231.68 |
| 1237.66 |
| 1248.69 |
| 1249.70 |
| 1411.82 |
| 1413.65 |
| 1419.68 |
| 1427.65 |
| 1433.69 |
| 1520.75 |
| 1538.76 |
| 1634.80 |
| 1739.84 |
| 1745.86 |
| 1764.99 |
| 1791.73 |
| 2258.04 |
| 2274.03 |
|
| Intensity |
| 1532 |
| 2186 |
| 1175 |
| 3210 |
| 1054 |
| 6872 |
| 1356 |
| 12455 |
| 1562 |
| 1153 |
| 2958 |
| 1273 |
| 1423 |
| 1420 |
| 1190 |
| 1038 |
| 2073 |
| 2980 |
| 1128 |
| 1739 |
| 1411 |
| 1693 |
|
|
(22 total) |
| | matched peaks |
| | contaminants |
|