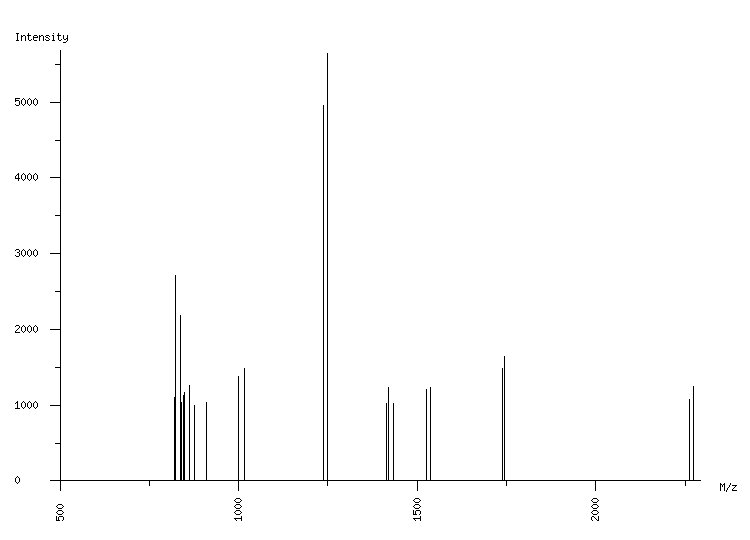
ORGANISM: Homo sapiens
GEL: Human AGS cells; cellular proteins; phosphoproteome
SPOT_ID: 78

|
| M/z |
| 821.31 |
| 822.28 |
| 824.30 |
| 838.29 |
| 840.30 |
| 846.30 |
| 847.32 |
| 863.32 |
| 875.31 |
| 909.30 |
| 999.58 |
| 1017.64 |
| 1237.66 |
| 1249.70 |
| 1413.64 |
| 1419.67 |
| 1433.68 |
| 1526.72 |
| 1538.75 |
| 1739.84 |
| 1745.86 |
| 2262.00 |
| 2274.02 |
|
| Intensity |
| 1103 |
| 1056 |
| 2711 |
| 2182 |
| 1036 |
| 1123 |
| 1164 |
| 1260 |
| 1000 |
| 1032 |
| 1373 |
| 1482 |
| 4954 |
| 5636 |
| 1028 |
| 1232 |
| 1022 |
| 1202 |
| 1239 |
| 1484 |
| 1646 |
| 1079 |
| 1242 |
|
|
(23 total) |
| | matched peaks |
| | contaminants |
|