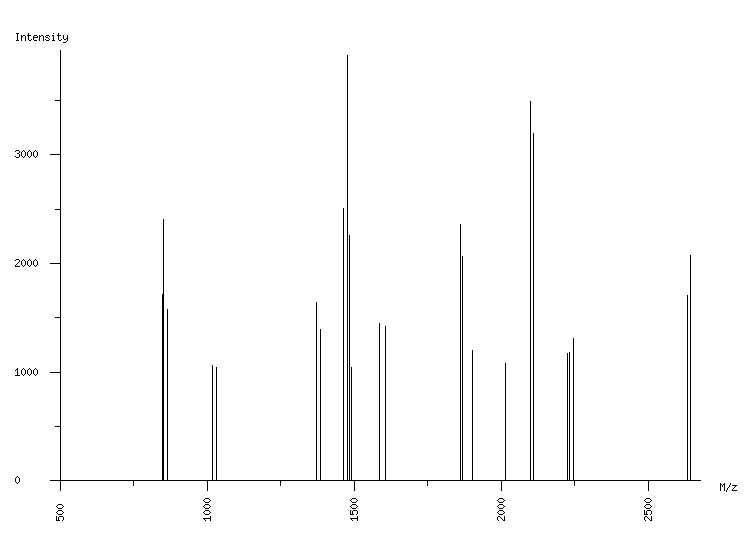
ORGANISM: Homo sapiens
GEL: Human AGS cells; cellular proteins; phosphoproteome
SPOT_ID: 52

|
| M/z |
| 848.53 |
| 850.52 |
| 864.55 |
| 1017.67 |
| 1033.70 |
| 1372.65 |
| 1384.69 |
| 1464.70 |
| 1476.74 |
| 1477.73 |
| 1483.75 |
| 1490.76 |
| 1587.78 |
| 1605.83 |
| 1861.96 |
| 1867.98 |
| 1901.24 |
| 2015.27 |
| 2099.04 |
| 2111.08 |
| 2226.12 |
| 2233.09 |
| 2245.20 |
| 2632.25 |
| 2644.31 |
|
| Intensity |
| 1719 |
| 2402 |
| 1578 |
| 1060 |
| 1047 |
| 1640 |
| 1391 |
| 2507 |
| 3913 |
| 1226 |
| 2255 |
| 1043 |
| 1447 |
| 1417 |
| 2358 |
| 2064 |
| 1204 |
| 1079 |
| 3487 |
| 3196 |
| 1172 |
| 1185 |
| 1313 |
| 1703 |
| 2078 |
|
|
(25 total) |
| | matched peaks |
| | contaminants |
|