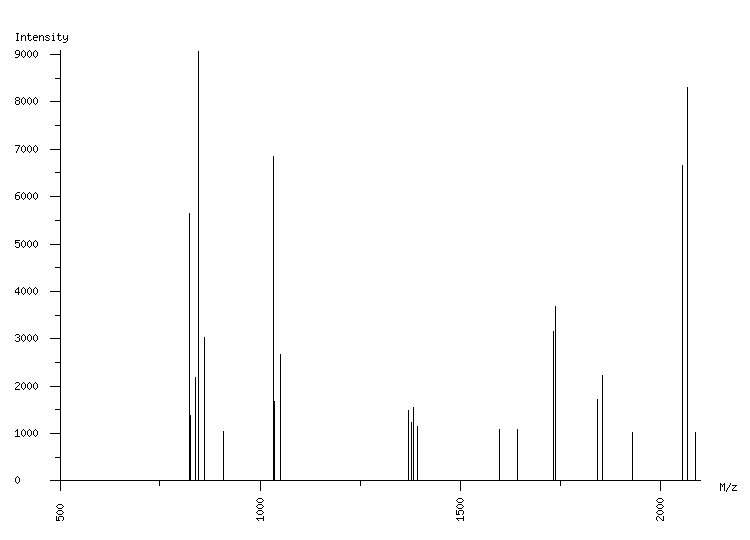
ORGANISM: Homo sapiens
GEL: Human AGS cells; cellular proteins; phosphoproteome
SPOT_ID: 43

|
| M/z |
| 823.14 |
| 825.13 |
| 839.10 |
| 845.11 |
| 861.10 |
| 909.04 |
| 1034.15 |
| 1036.15 |
| 1050.13 |
| 1371.75 |
| 1378.74 |
| 1383.80 |
| 1394.72 |
| 1597.85 |
| 1642.88 |
| 1732.88 |
| 1738.90 |
| 1844.90 |
| 1856.93 |
| 1930.94 |
| 2057.09 |
| 2068.12 |
| 2069.13 |
| 2088.87 |
|
| Intensity |
| 5640 |
| 1383 |
| 2190 |
| 9071 |
| 3025 |
| 1049 |
| 6849 |
| 1670 |
| 2676 |
| 1481 |
| 1238 |
| 1542 |
| 1144 |
| 1089 |
| 1077 |
| 3164 |
| 3684 |
| 1712 |
| 2216 |
| 1025 |
| 6647 |
| 1168 |
| 8293 |
| 1023 |
|
|
(24 total) |
| | matched peaks |
| | contaminants |
|