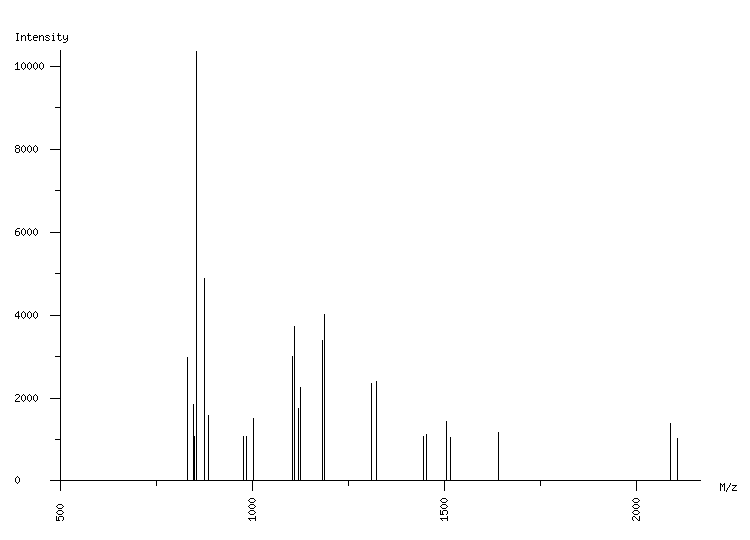
ORGANISM: Homo sapiens
GEL: Human AGS cells; cellular proteins; phosphoproteome
SPOT_ID: 42

|
| M/z |
| 830.30 |
| 831.29 |
| 846.29 |
| 848.30 |
| 850.53 |
| 854.28 |
| 876.26 |
| 886.24 |
| 976.54 |
| 985.31 |
| 1003.34 |
| 1103.54 |
| 1104.58 |
| 1109.57 |
| 1110.61 |
| 1120.57 |
| 1126.58 |
| 1182.60 |
| 1188.62 |
| 1310.69 |
| 1322.73 |
| 1445.80 |
| 1451.82 |
| 1504.85 |
| 1515.70 |
| 1640.78 |
| 2088.08 |
| 2106.17 |
|
| Intensity |
| 2975 |
| 1267 |
| 1033 |
| 1836 |
| 1080 |
| 10355 |
| 4875 |
| 1566 |
| 1074 |
| 1073 |
| 1505 |
| 1370 |
| 2999 |
| 1522 |
| 3731 |
| 1749 |
| 2255 |
| 3396 |
| 4002 |
| 2343 |
| 2391 |
| 1084 |
| 1127 |
| 1445 |
| 1043 |
| 1158 |
| 1376 |
| 1028 |
|
|
(28 total) |
| | matched peaks |
| | contaminants |
|