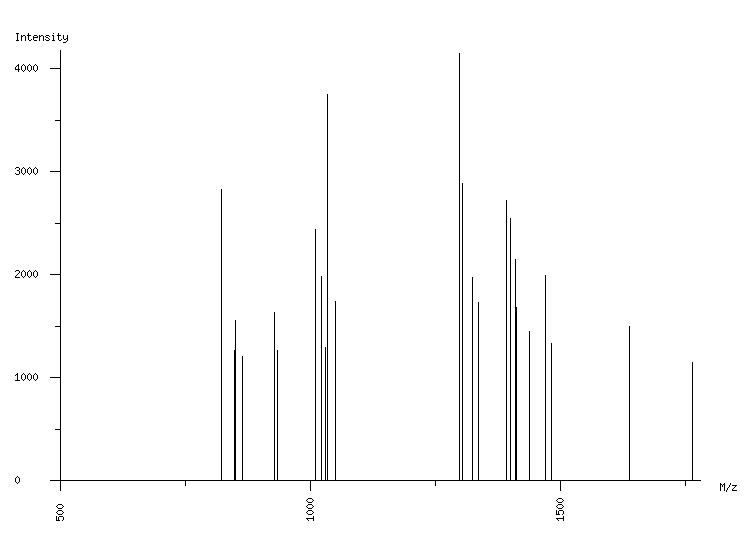
ORGANISM: Homo sapiens
GEL: Human AGS cells; cellular proteins; phosphoproteome
SPOT_ID: 41

|
| M/z |
| 823.09 |
| 848.51 |
| 850.53 |
| 864.53 |
| 928.53 |
| 934.54 |
| 1011.58 |
| 1023.61 |
| 1030.57 |
| 1034.11 |
| 1050.08 |
| 1299.71 |
| 1305.72 |
| 1325.71 |
| 1337.76 |
| 1392.80 |
| 1400.77 |
| 1410.86 |
| 1412.82 |
| 1439.79 |
| 1471.71 |
| 1483.75 |
| 1639.89 |
| 1764.87 |
|
| Intensity |
| 2831 |
| 1266 |
| 1557 |
| 1209 |
| 1630 |
| 1268 |
| 2435 |
| 1986 |
| 1296 |
| 3753 |
| 1740 |
| 4149 |
| 2882 |
| 1969 |
| 1735 |
| 2718 |
| 2541 |
| 2152 |
| 1687 |
| 1448 |
| 1989 |
| 1329 |
| 1497 |
| 1154 |
|
|
(24 total) |
| | matched peaks |
| | contaminants |
|