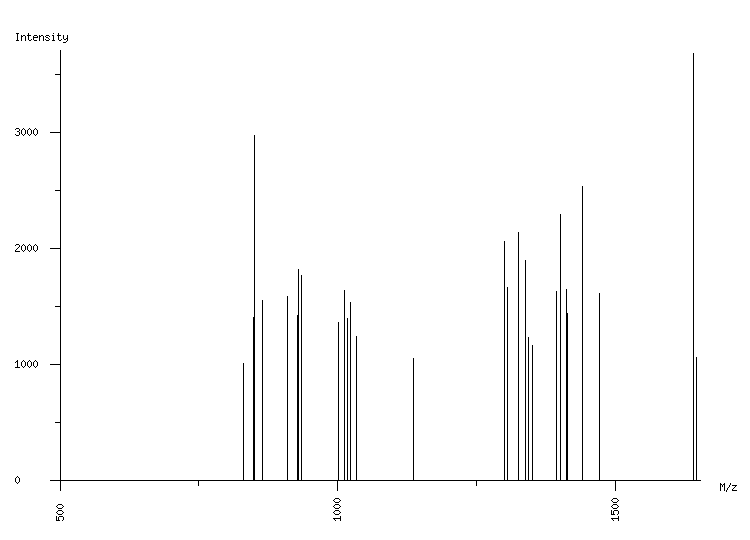
ORGANISM: Homo sapiens
GEL: Human AGS cells; cellular proteins; phosphoproteome
SPOT_ID: 40

|
| M/z |
| 830.38 |
| 848.52 |
| 850.52 |
| 864.54 |
| 908.97 |
| 927.49 |
| 928.53 |
| 934.55 |
| 1001.59 |
| 1011.59 |
| 1017.65 |
| 1023.63 |
| 1033.65 |
| 1135.54 |
| 1299.70 |
| 1305.72 |
| 1325.72 |
| 1337.76 |
| 1343.62 |
| 1349.64 |
| 1392.80 |
| 1400.76 |
| 1410.86 |
| 1412.81 |
| 1439.80 |
| 1471.71 |
| 1639.92 |
| 1645.89 |
|
| Intensity |
| 1014 |
| 1406 |
| 2971 |
| 1551 |
| 1588 |
| 1423 |
| 1814 |
| 1768 |
| 1364 |
| 1634 |
| 1400 |
| 1531 |
| 1239 |
| 1056 |
| 2060 |
| 1660 |
| 2139 |
| 1894 |
| 1234 |
| 1164 |
| 1626 |
| 2294 |
| 1648 |
| 1437 |
| 2531 |
| 1616 |
| 3676 |
| 1063 |
|
|
(28 total) |
| | matched peaks |
| | contaminants |
|