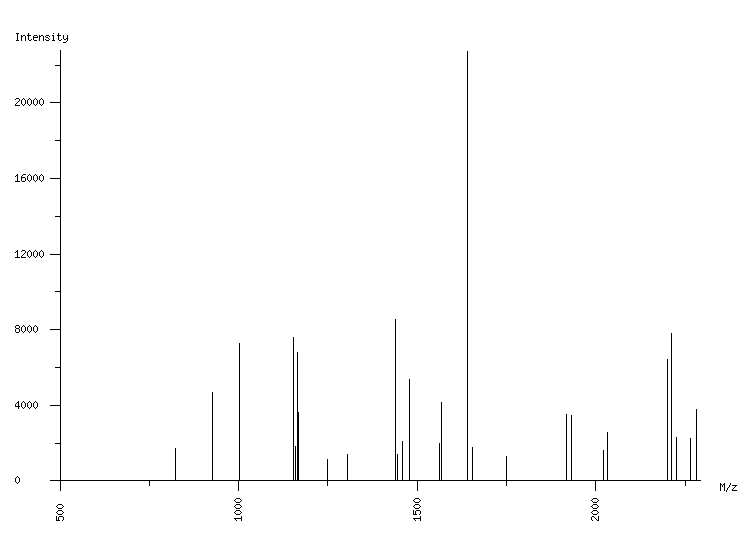
ORGANISM: Homo sapiens
GEL: Human AGS cells; cellular proteins; phosphoproteome
SPOT_ID: 12

|
| M/z |
| 824.27 |
| 927.50 |
| 1001.59 |
| 1152.69 |
| 1160.58 |
| 1163.69 |
| 1164.73 |
| 1166.62 |
| 1249.64 |
| 1305.71 |
| 1439.81 |
| 1445.77 |
| 1457.79 |
| 1479.80 |
| 1561.70 |
| 1567.73 |
| 1639.94 |
| 1653.95 |
| 1750.96 |
| 1919.01 |
| 1931.06 |
| 2021.96 |
| 2033.99 |
| 2200.02 |
| 2212.09 |
| 2226.09 |
| 2264.11 |
| 2282.15 |
|
| Intensity |
| 1712 |
| 4682 |
| 7293 |
| 7578 |
| 1840 |
| 1853 |
| 6775 |
| 3615 |
| 1162 |
| 1384 |
| 8532 |
| 1387 |
| 2079 |
| 5368 |
| 1967 |
| 4155 |
| 22723 |
| 1792 |
| 1293 |
| 3522 |
| 3441 |
| 1600 |
| 2588 |
| 6425 |
| 7783 |
| 2275 |
| 2248 |
| 3768 |
|
|
(28 total) |
| | matched peaks |
| | contaminants |
|