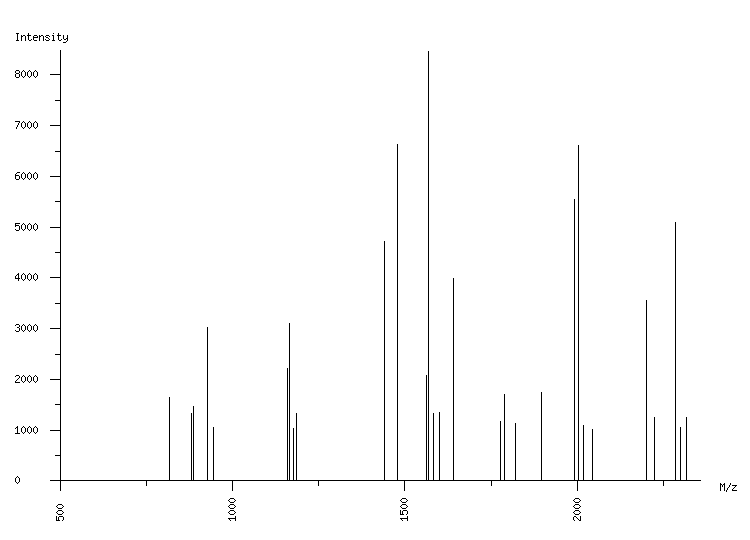
ORGANISM: Homo sapiens
GEL: Human AGS cells; cellular proteins; phosphoproteome
SPOT_ID: 10

|
| M/z |
| 818.51 |
| 880.40 |
| 886.41 |
| 927.49 |
| 946.53 |
| 1160.57 |
| 1166.58 |
| 1178.57 |
| 1184.60 |
| 1439.82 |
| 1479.80 |
| 1561.68 |
| 1567.73 |
| 1581.73 |
| 1600.76 |
| 1639.94 |
| 1776.82 |
| 1788.87 |
| 1821.91 |
| 1894.94 |
| 1991.99 |
| 2004.03 |
| 2018.05 |
| 2045.02 |
| 2200.02 |
| 2225.10 |
| 2284.17 |
| 2300.15 |
| 2318.17 |
|
| Intensity |
| 1652 |
| 1320 |
| 1475 |
| 3016 |
| 1055 |
| 2213 |
| 3093 |
| 1042 |
| 1322 |
| 4710 |
| 6632 |
| 2072 |
| 8453 |
| 1330 |
| 1342 |
| 3981 |
| 1177 |
| 1704 |
| 1135 |
| 1749 |
| 5536 |
| 6602 |
| 1087 |
| 1009 |
| 3550 |
| 1256 |
| 5086 |
| 1053 |
| 1243 |
|
|
(29 total) |
| | matched peaks |
| | contaminants |
|