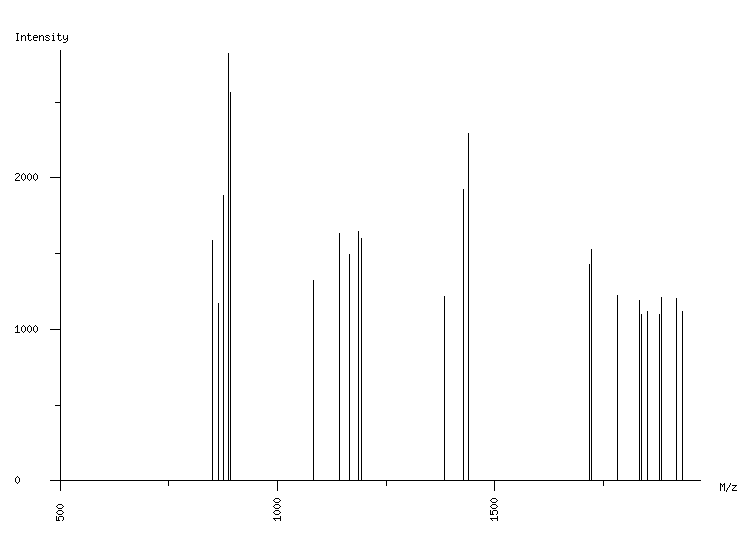
ORGANISM: Homo sapiens
GEL: Human AGS cells; cellular proteins; phosphoproteome
SPOT_ID: 9

|
| M/z |
| 850.52 |
| 864.53 |
| 876.47 |
| 886.43 |
| 892.45 |
| 1083.60 |
| 1143.59 |
| 1164.72 |
| 1186.62 |
| 1192.63 |
| 1383.75 |
| 1427.82 |
| 1439.85 |
| 1716.87 |
| 1722.89 |
| 1782.89 |
| 1833.92 |
| 1837.89 |
| 1851.96 |
| 1877.92 |
| 1883.93 |
| 1918.96 |
| 1931.03 |
|
| Intensity |
| 1588 |
| 1171 |
| 1887 |
| 2820 |
| 2565 |
| 1324 |
| 1635 |
| 1493 |
| 1648 |
| 1602 |
| 1219 |
| 1922 |
| 2291 |
| 1431 |
| 1526 |
| 1223 |
| 1193 |
| 1101 |
| 1119 |
| 1098 |
| 1208 |
| 1206 |
| 1116 |
|
|
(23 total) |
| | matched peaks |
| | contaminants |
|